Map Unavailable
Date/Time
Date(s) - 2013/06/08
2:00 pm - 8:15 pm
Categories

https://sudoroom.org/wiki/Infographic
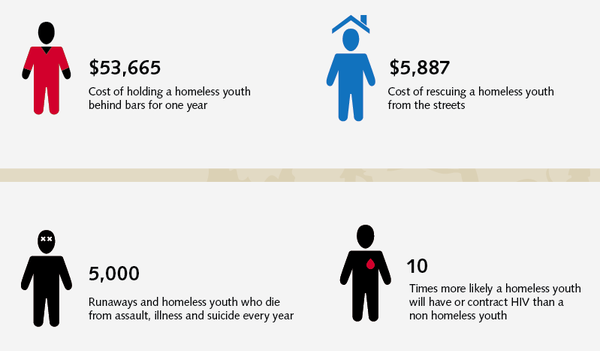
- Learn to take complex data and condense information into powerful graphics that spur action resulting in positive economic and social change.
- Leave the session with a flyer, a powerpoint slide or a web graphic.
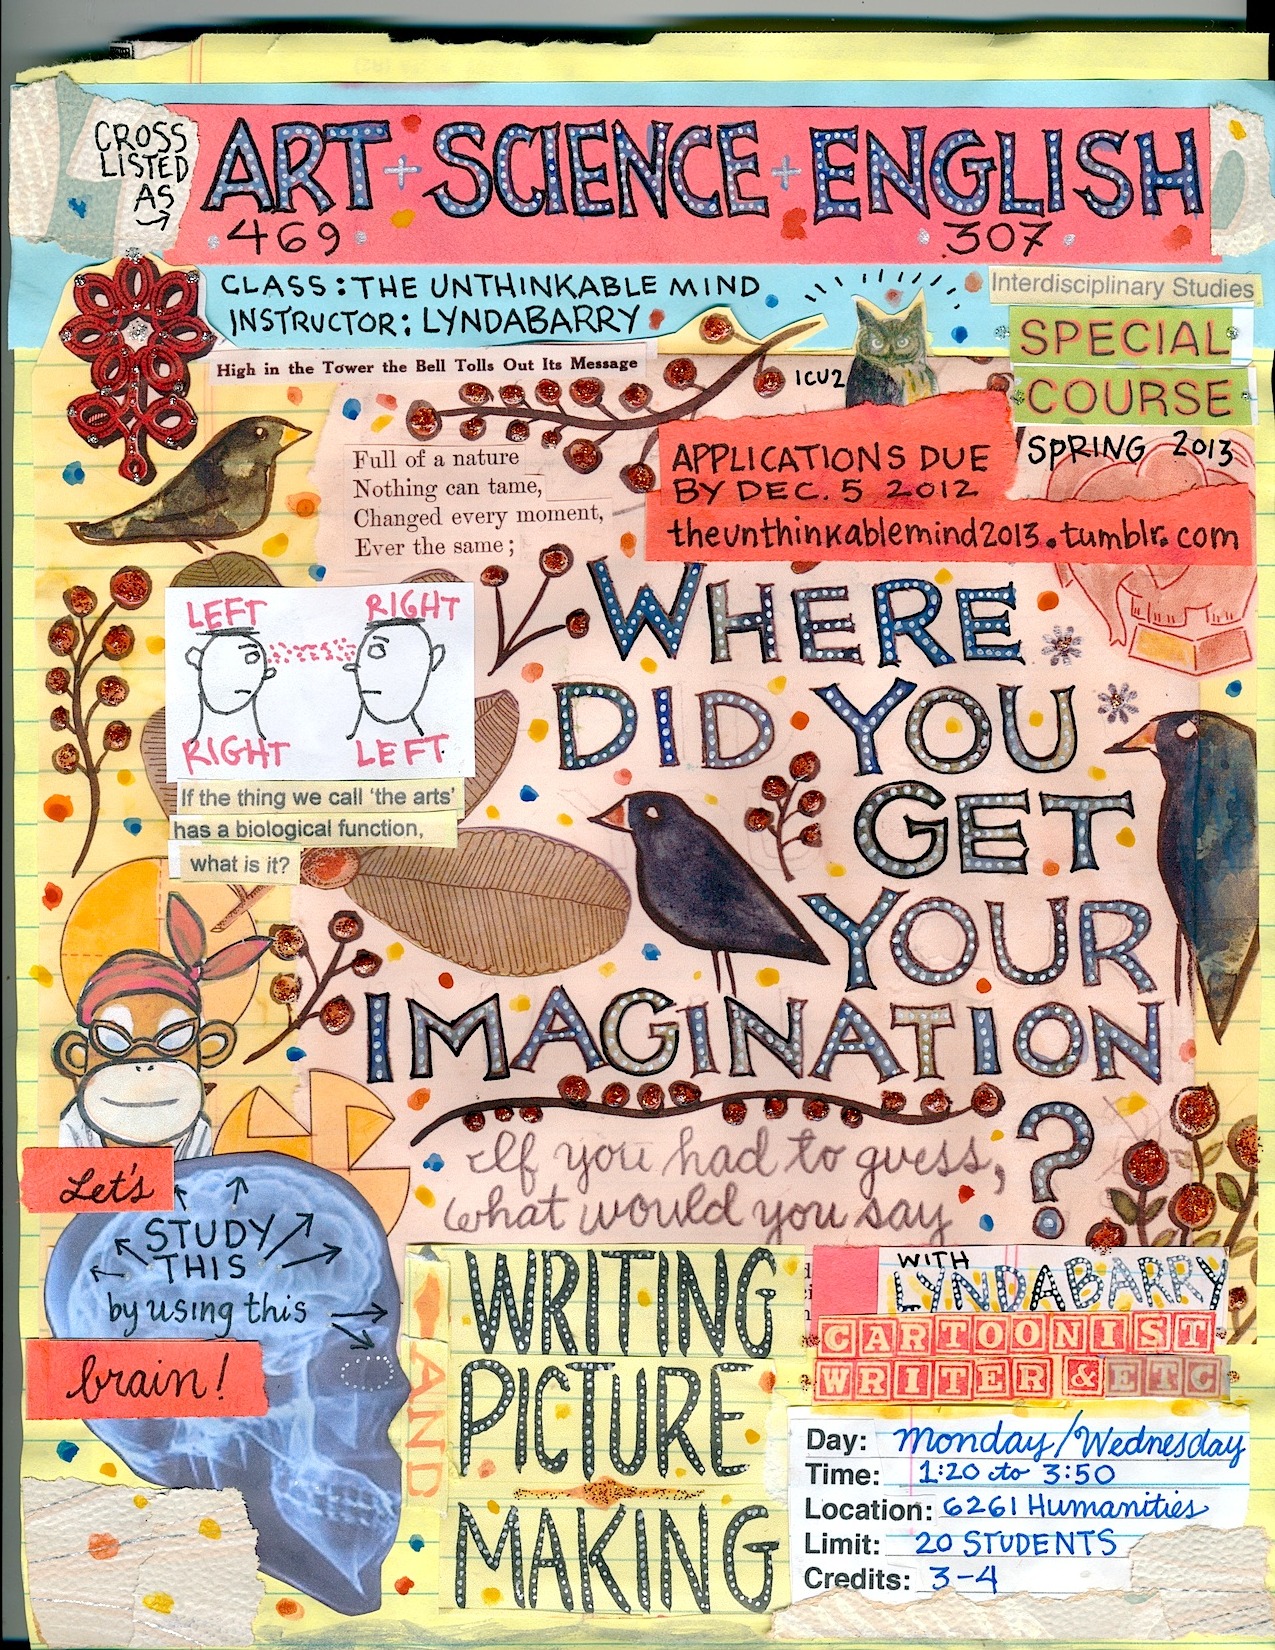
We’ll review examples from the famous Tufte Book Visualizing Information. We’ll also work with SudoRoom resident mathematicians to show how powerfully data can be visualized and change the course of events. We’ll also learn from lessons made by famous comic book artists such as R. Crumb, Art Spiegelman, matt Groenig and Lynda Barry
Inspiration
We are all smart, opinionated people working towards positive social change. We’d love to draw as many interesting people with smart opinions as possible.
- User:Maximilianklein Sex ratios in Wikidata, wikipedia & the VIAF –http://hangingtogether.org/?p=2877
- Community Democracy Project